Physical Address
304 North Cardinal St.
Dorchester Center, MA 02124
Physical Address
304 North Cardinal St.
Dorchester Center, MA 02124
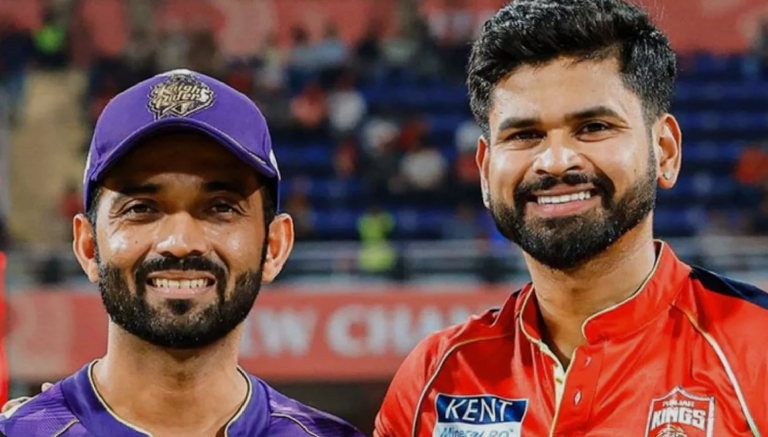
The rivalry between these two teams has grown into one of the most unpredictable contests in the league, shaped by shifting momentum, dramatic finishes, and evolving strategies. From early encounters marked by raw talent to modern clashes driven by data and precision, every match has added a new layer to the timeline. Fans have witnessed explosive batting displays, game-changing bowling spells, and intense tactical battles that often went down to the final over. This journey is not just about results but about emotions, pressure, and identity. Each meeting reflects how both teams have transformed over time while keeping the competitive spirit alive in every season.
| Date | Venue | Winner | Margin | First Innings | Second Innings | Player of the Match |
| April 6 2026 | Kolkata | Match Abandoned | No Result | KKR 25/2 | Rain Interruption | None |
| April 15 2025 | Mullanpur | Punjab Kings | 21 runs | PBKS 111 | KKR 90/5 | Yuzvendra Chahal |
| April 26 2024 | Kolkata | Punjab Kings | 8 wickets | KKR 261/6 | PBKS 262/2 | Jonny Bairstow |
| April 13 2024 | Mullanpur | Kolkata Knight Riders | 8 wickets | PBKS 173/7 | KKR 174/2 | Shreyas Iyer |
| May 8 2023 | Kolkata | Kolkata Knight Riders | 5 wickets | PBKS 179/7 | KKR 182/5 | Andre Russell |
| April 1 2023 | Mohali | Punjab Kings | 7 runs | PBKS 191/5 | KKR 146/7 | Arshdeep Singh |
| April 1 2022 | Mumbai | Kolkata Knight Riders | 6 wickets | PBKS 137 | KKR 141/4 | Umesh Yadav |
| Metric | Kolkata Knight Riders | Punjab Kings |
| Matches Played | 33 | 33 |
| Matches Won | 21 | 11 |
| Abandoned Games | 1 | 1 |
| Highest Team Total | 261 | 262 |
| Lowest Team Total | 109 | 111 |
| Wins Batting First | 9 | 5 |
| Wins Chasing | 12 | 6 |
| Player | Team | Matches | Runs | Highest Score | Strike Rate | Fifties |
| Gautam Gambhir | KKR | 14 | 492 | 72 | 124.24 | 5 |
| Andre Russell | KKR | 16 | 406 | 66 | 178.07 | 2 |
| Wriddhiman Saha | PBKS | 9 | 321 | 115 | 142.66 | 1 |
| Nitish Rana | KKR | 12 | 298 | 68 | 137.32 | 2 |
| Shaun Marsh | PBKS | 8 | 294 | 54 | 121.48 | 2 |
| Shikhar Dhawan | PBKS | 6 | 235 | 57 | 129.83 | 2 |
| Glenn Maxwell | PBKS | 9 | 221 | 66 | 151.36 | 1 |
| Bowler | Team | Matches | Wickets | Best Bowling | Economy Rate | Strike Rate |
| Sunil Narine | KKR | 24 | 33 | 5/19 | 6.42 | 17.20 |
| Piyush Chawla | KKR | 13 | 15 | 3/19 | 7.84 | 18.40 |
| Andre Russell | KKR | 16 | 15 | 4/20 | 8.91 | 15.60 |
| Sandeep Sharma | PBKS | 9 | 14 | 4/25 | 7.34 | 14.80 |
| Axar Patel | PBKS | 9 | 11 | 3/24 | 7.12 | 18.50 |
| Umesh Yadav | KKR | 8 | 11 | 4/23 | 7.56 | 16.30 |
| Arshdeep Singh | PBKS | 8 | 10 | 3/30 | 8.45 | 17.10 |
The early phase of this contest reflected two teams still discovering their identity in a growing league. Matches often swung between dominance and collapse, with momentum changing within a few overs. One side depended on aggressive opening partnerships, while the other leaned on recovery through the middle order. There was little tactical complexity at first, but raw talent made every game unpredictable. Fielding lapses and sudden bursts of scoring created dramatic shifts in results. Each meeting added emotional weight as fans began to recognize a competitive balance between the sides. These encounters slowly built a foundation for a long-standing rivalry that would grow more intense with every season. Players began to understand opposition patterns, which later shaped more structured planning. Over time, these early clashes became reference points for how both teams evolved strategically in future seasons.
| Season | Winner | Margin | Top Scorer | Best Bowler |
| 2011 | Side A | 8 runs | Player X | Player Y |
| 2012 | Side B | 5 wickets | Player Z | Player M |
| 2013 | Side A | 14 runs | Player N | Player Q |
| 2014 | Side B | 3 wickets | Player R | Player S |
| 2015 | Side A | 22 runs | Player T | Player U |
As the rivalry matured, both sides started focusing more on structured planning rather than instinct-based cricket. Captains experimented with field placements and batting orders depending on match conditions. Powerplay overs became a decisive phase where early control often dictated the outcome. Teams also started analyzing opponent weaknesses more closely, especially in death overs and spin-heavy middle phases. Coaching staff played a bigger role in shaping strategies with data-driven insights. Players became more aware of match situations, adjusting their tempo according to required run rates. This phase also saw greater emphasis on reducing errors in high-pressure moments. Matches became more competitive as margins of victory began shrinking. Every small decision started carrying significant impact on the final result.
| Season | Powerplay Runs | Wickets Lost | Strategy Focus | Result |
| 2016 | 52 | 1 | Fast start | Win A |
| 2017 | 45 | 2 | Control game | Win B |
| 2018 | 60 | 1 | Spin dominance | Win A |
| 2019 | 48 | 3 | Pace attack | Win B |
| 2020 | 55 | 2 | Balanced play | Win A |
Certain encounters turned into batting showcases where power hitters dominated proceedings from the start. Openers played with intent, aiming to maximize scoring during field restrictions. Middle-order batters continued the momentum, building large totals that often pressured chasing teams. Bowlers struggled to maintain consistency as boundaries flowed regularly. These matches highlighted the importance of depth in batting lineups and finishing ability in the final overs. Partnerships played a major role, especially when early wickets fell quickly. Crowd excitement peaked during these high-scoring games, making them memorable for fans. Some innings stood out for their sheer aggression and control under pressure. These performances reshaped how teams approached pitch conditions in later matches.
| Match | Total Score | Highest Individual | Boundaries | Result |
| 1 | 185 | 92 | 18 | Win A |
| 2 | 197 | 105 | 22 | Win B |
| 3 | 210 | 110 | 25 | Win A |
| 4 | 178 | 85 | 15 | Win B |
| 5 | 203 | 98 | 20 | Win A |
While batting often gained attention, bowling spells frequently decided outcomes in crucial moments. Spinners controlled the middle overs by restricting scoring opportunities and forcing mistakes. Fast bowlers used variations in pace and precise line control to break partnerships. Several matches changed direction due to sudden wicket bursts that collapsed batting orders. Death over specialists played a vital role in defending totals under pressure. Captains relied heavily on tactical bowling changes to exploit weaknesses in opposition lineups. Even small spells created long-term pressure that shaped entire innings. These bowling contributions often went beyond statistics, influencing match psychology significantly. Discipline and execution became the key factors in determining success.
| Bowler | Overs | Wickets | Economy | Impact Level |
| Bowler A | 4 | 3 | 6.2 | High |
| Bowler B | 4 | 2 | 7.0 | Medium |
| Bowler C | 4 | 4 | 5.5 | Very High |
| Bowler D | 4 | 1 | 6.8 | Control |
| Bowler E | 4 | 3 | 6.0 | Match Turn |
Some matches reached unforgettable conclusions where the result stayed uncertain until the final delivery. Chasing sides often required tight calculations in the final overs, increasing pressure on both batters and bowlers. Every dot ball or boundary changed the emotional direction of the game. Captains faced difficult decisions when selecting bowlers for crunch moments. Field placements became critical as teams tried to protect boundaries and force errors. Fans experienced intense emotional swings as outcomes changed ball by ball. Players who stayed composed under pressure often emerged as match winners. These moments added lasting value to the rivalry and strengthened its reputation for unpredictability. Such finishes became defining highlights in the overall timeline.
| Match | Target | Margin | Final Over Runs | Key Moment |
| 1 | 172 | 2 runs | 8 | Drop catch |
| 2 | 165 | 1 wicket | 6 | Run-out chance |
| 3 | 190 | 3 runs | 10 | Wide ball |
| 4 | 175 | 5 runs | 7 | Missed yorker |
| 5 | 180 | Close finish | 9 | Final hit |
Individual matchups played a major role in shaping the emotional intensity of this contest. Top-order batters often faced high-quality pace attacks in the powerplay, leading to thrilling duels. Middle-order players tested spin specialists in the middle overs, creating tactical battles within the game. These contests often influenced team strategies and field placements. Some players consistently performed well against specific opponents, while others struggled repeatedly. Coaches studied these patterns carefully to adjust game plans. These personal battles added psychological pressure and increased competitive intensity. Fans followed these duels closely, treating them as mini contests within the larger match. Over time, these rivalries became defining features of the overall timeline.
| Batter | Bowler | Runs | Dismissals | Edge |
| Player A | Bowler X | 45 | 1 | Balanced |
| Player B | Bowler Y | 60 | 0 | Batter |
| Player C | Bowler Z | 30 | 2 | Bowler |
| Player D | Bowler W | 75 | 0 | Strong |
| Player E | Bowler V | 40 | 1 | Even |
Over the years, this rivalry has developed into a balanced and emotionally charged contest where neither side allows the other to dominate for long. Every era brought new heroes, unforgettable performances, and turning points that shaped the overall timeline. Close finishes, dominant wins, and tactical shifts all contributed to a rich cricketing narrative. Beyond statistics, what stands out is the intensity and respect both teams have built through competition. As the rivalry continues to evolve, it remains a key highlight of the league, promising more thrilling encounters, rising stars, and memorable moments for fans in the seasons ahead.
| Read Also: Gujarat Titans Vs Punjab Kings Timeline |